THIS PAGE IS UNDER CONSTRUCTION
This page is intended to provide researchers with useful tools to aid their research. These tools may be a webpage link to certain tools (such as a website that allows you to search for information related to your favourite gene) or softwares.
RegNetwork: Regulatory Network Repository
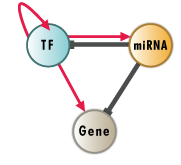
RegNetwork is a data repository of five-type transcriptional and posttranscriptional regulatory relationships for human and mouse. Link to the About page.
HATA: The Human Adipose Tissue Atlas

The Koethe research group have generated a single cell RNAseq and CITE-seq dataset consisting 59 HIV+ (20 non-diabetic, 19 pre-diabetic, 20 diabetic) and 32 HIV- diabetic patients.
Very nice tool.
ENCODE

The ENCODE Portal, developed and maintained by the Data Coordination Center (ENCODE DCC), is the canonical source for all experimental metadata and data from ENCODE and associated projects. The ENCODE Portal contains raw and ground-level analysis data generated by participating mapping centers using a wide-range of assays (integrative analysis data are available at the SCREEN portal. The Portal also stores records of the materials and methods used to perform the assays and subsequent analysis. No account is needed to view or download released data.
Link to the Tutorial page.
IHEC: The International Human Epigenome Consortium

The International Human Epigenome Consortium (IHEC) makes available comprehensive sets of reference epigenomes relevant to health and disease. The IHEC Data Portal can be used to view, search and download the data already released by the different IHEC-associated projects.
Link to the Help page.
Blueprint Project

Explore the behaviour of your candidate genes, pathways or genome regions across the Blueprint datasets.
The Blueprint project is providing in this release epigenomic analysis from 1039 samples to the scientific community. Their associated epigenomes are characterized by: gene and transcript expression (from RNA-Seq experiments), hyper and hypo methylated regions (derived from WGBS experiments), chromatin accessibility (DNAseI-Seq), and 9 Histone marks binding activity (ChIP-Seq)
Use this tool to explore the behaviour of your genes and pathways in the BLUEPRINT analysis for 62 cellular types and cellular lines.
Link to the knowing the interface page. Link to the knowing the charts page.
EpiFactors
EpiFactors is a database for epigenetic factors, corresponding genes and products.
Link to the help and information page.
CistromeDB

CistromeDB Toolkit - Check what factors regulate your gene of interest, what factors bind in your interval or have a significant binding overlap with your peak set.
Cistrome-GO - Predict the function of transcription factor perturbed expression from Transcription Factor ChIP-seq data.
Link to the about page. Link to the documentation page.
ReMap2022
ReMap is a large scale integrative analysis of DNA-binding experiments for Homo sapiens, Mus musculus, Drosophila melanogaster and Arabidopsis thaliana transcriptional regulators. the catalogues are the results of the manual curation of ChIP-seq, ChIP-exo, DAP-seq from public sources (GEO, ENCODE, ENA).
A tour of the site can be found at the top right-hand side of the web page.
ChIP-Atlas

A data-mining suite for exploring epigenomic landscapes by fully integrating 419,000 ChIP-seq, ATAC-seq and Bisulfate-seq experiments.
Cistrome-GO - Predict the function of transcription factor perturbed expression from Transcription Factor ChIP-seq data.
Link to the documentation page.
FANTOM5: Functional Annotation of the Mammalian Genome

The FANTOM5 project is a worldwide collaborative project aiming at identifying all functional elements in mammalian genomes.
Link to the FAQ page.
FORGEdb

FORGEdb is a tool for studying regulatory genomic variants, the “dark matter” of the genome. FORGEdb annotates these little-known variants with eQTLs, chromatin looping, epigenetic marks, TF binding sites, and more!
Link to the about page.
CuratedAtlasQueryR
CuratedAtlasQueryR is a query interface in R that allows the programmatic exploration and retrieval of the harmonised, curated and reannotated CELLxGENE single-cell human cell atlas. Data can be retrieved at cell, sample, or dataset levels based on filtering criteria.
ezSinglecell
ezSinglecell is an interactive and easy-to-use application for analysing various single-cell and spatial omics data trypes without requiring prior programming knowledge. It combines the best-performing public methods for in-depth data analysis and interactive data visualisation. It consists of five modules, each designed to be a comprehensive workflow for one data type or task. It also allows crosstalk between different modules within a defined interface.
Link to the help page which contains manuals for each module.
Cellar

Cellar is an interactive tool for analysing single-cell omics data. The tool supports, but is not limited to, scRNA-seq, scATAC-seq, CODEX, SNARE-seq, sciRNA-seq, and visium. It supports pre-processing, dimensionality reduction, clustering, DE gene testing, enrichment analysis, culster and gene visualisation modules, projection to spatial tiles, label transfer, and semi-supervised clustering among others.
Link to the documentation page. There are also video tutorials available.
ASAP: Automated Single-cell Analysis Portal

ASAP is a web-based collaborative portal that allows the analysis of single-cell transcritpomic data.
Link to the tutorial page.
iSEE

iSEE is a bioconductor package that provides an interactive Shiny-based graphical user interface for exploring data stored in SummarizedExperiment objects.
Link to the installation page that contains HTML pages and R Scripts.
VISION

VISION is an R package that aids in the interpretation of single-cell RNA-seq data by selecting for gene signatures which describe coordinated variation between cells. Whilst the software only requires an expression matric and a signature library (available in online databases), it is also desitnged to integrate into existing scRNA-seq analysis pipelines by taking advantage of precomputed dimensionality reductions, trajectory inferences or clustering results. The results of this analysios are makde available through a dynamic web-app which can be shared with collaborators without requiring them to install any additional softwares.
Link to the getting started vignette.
SComatic
SComatic is a tool that provides functionalities to detect somatic single-nucleotide mutations in high-throughput single-cell genomics and transcriptomics data sets, such as single-cell RNA-seq and single-cell ATAC-seq.
scRNA-tools

The scRNA-tools database is a catalogue of tools for analysing single-cell RNA sequencing data. Really nice website that can be your one-stop shop to find the right tool for the analysis you are looking to perform!
Link to the FAQ page.
Kaplan-Meier Plotter

The Kaplan Meier plotter is capable of assessing the correlation between the expression of all genes (mRNA, miRNA, protein, & DNA) and survival in 35k+ samples from 21 tumor types. Applied statistical tools include Cox proportional hazards regression and the computation of the False Discovery Rate. With 20,000 analyses per day, the KM-plotter is a worldwide reference for the discovery and validation of survival biomarkers.
InnateDB

InnateDB is publicly available database of the genes, proteins, experimentally-verified interactions and signaling pathways involved in the innate immune response of humans, mice and bovines to microbial infection. The database captures an improved coverage of the innate immunity interactome by integrating known interactions and pathways from major public databases together with manually-curated data into a centralised resource. To date, 18,780 interactions have been manually curated by the InnateDB curation team. The database can be mined as a knowledgebase or used with our integrated bioinformatics and visualization tools for the systems level analysis of the innate immune response.
A website tutorial can be found at the top right of the home page.
ROC Plotter

The ROC plotter is capable of linking gene expression and therapy response using transcriptome-level data of breast, ovarian, and colorectal cancer patients and glioblastomas. The custom plotter generates a ROC plot for user-uploaded data.
muTarget

muTarget is a cancer biomarker / target discovery tool with two major functions
1) With a “Genotype” run one can identify gene(s) showing altered expression in samples harbouring a mutated input gene. This option is useful in case one searches new drug targets in a cohort of patients with a given mutation.
2) With a “Target” run one can identify mutations resulting in expression change in the input gene. This option is useful in case one has a drug target gene, and patient cohorts with enriched expression is the question.
TNMplot: differential gene expression analysis in Tumour, Normal, and Metastatic tissues

Realy nice tool! Performs a whole range of pan-cancer analyses and provides multiple different outputs such as dot plots, bar charts, correlation plots, box plots and more!
Tabula Sapiens: Human transcriptome reference at single cell resolution

Tabula Sapiens is a benchmark, first-draft human cell atlas of nearly 500,000 cells from 24 organs of 15 normal human subjects. This work is the product of the Tabula Sapiens Consortium. Taking the organs from the same individual controls for genetic background, age, environment, and epigenetic effects, and allows detailed analysis and comparison of cell types that are shared between tissues. Our work creates a detailed portrait of cell types as well as their distribution and variation in gene expression across tissues and within the endothelial, epithelial, stromal and immune compartments.
tfLink

TFLink gateway uniquely provides comprehensive and highly accurate information on transcription factor - target gene interactions, nucleotide sequences and genomic locations of transcription factor binding sites for human and six model organisms: mouse (Mus musculus), rat (Rattus norvegicus), zebrafish (Danio rerio), fruit fly (Drosophila melanogaster), nematode (Caenorhabditis elegans), and yeast (Saccharomyces cerevisiae). TFLink contains clearly identified data, and provides information about the sources: databases, experimental methods and publications. To create TFLink, we examined the large transcription factor databases, and selected ten resources for integration: DoRothEA, GTRD, HTRIdb, JASPAR, ORegAnno, REDfly, ReMap, TRED, TRRUST, and Yeastract. By exploiting these database sources, we integrated accurate, small-scale experimental data and the results of large-scale experiments.
Harmonizome 3.0
Thanks to technological advances in genomics, transcriptomics, proteomics, metabolomics, and related fields, projects that generate a large number of measurements of the properties of cells, tissues, model organisms, and patients are becoming commonplace in biomedical research. In addition, curation projects are making great progress mining biomedical literature to extract and aggregate decades worth of research findings into online databases. Such projects are generating a wealth of information that potentially can guide research toward novel biomedical discoveries and advances in healthcare. To facilitate access to and learning from biomedical Big Data, we created the Harmonizome: a collection of information about genes and proteins from 140 datasets provided by 80 online resources.
To create the Harmonizome, we distilled information from original datasets into attribute tables that define significant associations between genes and attributes, where attributes could be genes, proteins, cell lines, tissues, experimental perturbations, diseases, phenotypes, or drugs, depending on the dataset. Gene and protein identifiers were mapped to NCBI Entrez Gene Symbols and attributes were mapped to appropriate ontologies. We also computed gene-gene and attribute-attribute similarity networks from the attribute tables. These attribute tables and similarity networks can be integrated to perform many types of computational analyses for knowledge discovery and hypothesis generation.
hTFtarget: Database of Human Transcription Factor Targets

Transcription factors (TFs) as key regulators could modulate the expression of target genes by binding to specific DNA sequences of their promoter(s) or enhancer(s). The spatiotemporal TF-target regulations play vital roles throughout the life course of organisms, especially for human beings. Thus, the identification of TF-target regulation in human is a basis for understanding the molecular regulatory mechanisms underlying biological processes including the development and pathogenesis. hTFtarget has curated comprehensive TF-target regulations from large-scale of ChIP-Seq data of human TFs (7,190 experiment samples of 659 TFs) in 569 conditions (399 types of cell line, 129 classes of tissues or cells, and 141 kinds of treatments). hTFtarget customized an analysis workflow to detect reliable TF-target regulations, which integrated the peak information of ChIP-Seq data with epigenomic modification status (Details in Document page).
pathlinkR

pathlinkR is an R package designed to facilitate analysis of RNA-Seq results. Specifically, our aim with pathlinkR was to provide a number of tools which take a list of DE genes and perform different analyses on them, aiding with the interpretation of results. Functions are included to perform pathway enrichment, with muliplte databases supported, and tools for visualizing these results. Genes can also be used to create and plot protein-protein interaction networks, all from inside of R.
SRPlot

SRplot a freely accessible easy-to-use web server that integrated all of the commonly used data visualization and graphing functions together. It can be run easily with all Web browsers, with a user-friendly graphical interface, users can paste your data directly into the input box according to the defined file format. Modification operations can be easily performed, and graphs can be generated in real time. The resulting graphs can be downloaded in bitmap (PNG or TIFF) or vector (PDF or SVG) format in publication quality.
ssREAD: A Single-cell and Spatial RNA-Seq Database for Alzheimer’s Disease

iSeq: An Integrated Tool to Fetch Public Sequencing Data
